Extract, Transform, Load Process
ETL Process Mock-Up
Hello and welcome to another project. This one is a bit different than my previous projects and will deal with using Google Cloud Platform for creating and maintaining a data set that we can then use for reporting and analysis. By the time this project is complete, it will show a full-stack data science project using cloud tools.
Update 5/6/19: Added sentiment analysis graphs to make this project a little better to look at!
Update 5/10/19: Changed create_news_table functions to check for nulls and duplicates. Ideally we will be checking for duplicates when uploading to the database.
Update 5/20/19: Added entity extraction functions for writing to the news org dataframe as well as for separate analysis.
Overall Steps:
- Extract the data from our inputs (webpages, APIs, on-site tables) using a python script on a Compute Engine, and load them into a Google Cloud bucket.
- From the bucket, load the data into a CloudSQL database for more permanent storage.
- Query data from CloudSQL into a python program that will display the reports that we want to see.
This is a basic ETL process that is suited for businesses that need to:
- load and update their data infrequently (once a day or so)
- have data on the order of GigaBytes.
We could modify our framework slightly depending on the project. If the business needs to stream their data we could use Cloud Dataflow, and if much larger storage capabilities are needed we could use BigQuery or BigTable.
Our specific task today is to take a look at some different news organizations and see how they differ in their overall sentiment, and what kinds of stories they talk about. We will then generate a report that tracks their sentiment over time.
My specific reason for choosing this subject is that I had a hypothesis: Local news organizations will have an overall more positive sentiment than national or even global news organizations. Like any good scientist I need data to tell me the truth of my hypothesis, so lets get started!
Step 1: Extract the Data
Using Google’s News API, we have a good selection of national and global news organizations to access. Unfortunately, their local news options are pretty sparse, so we’ll use BeautifulSoup to scrape local news webpages for the analogous information we need.
Google News API: https://newsapi.org/docs
def create_news_table(source):

    #select which news org you want from Google's news API
    top_headlines = newsapi.get_top_headlines(sources= source)

    top_articles = top_headlines['articles']
    #Create an empty dataframe with the column titles for the info we want
    news_top_articles = pd.DataFrame(columns = ['title', 'content', 'date published'])

    #loop through the articles queried to select out the info
    for i in np.arange(len(top_articles)):
        title = top_articles[i]['title']
        content = top_articles[i]['content']
        date = top_articles[i]['publishedAt']

        #create a record in each loop
        news_top_article = pd.DataFrame([title, content, date])
        news_top_article = news_top_article.T
        news_top_article.columns = ['title', 'content', 'date published']

        #join the new record to the empty dataframe
        news_top_articles = pd.concat([news_top_articles, news_top_article])

        #only want the date so that SQL will take it
        news_top_articles['date_collected']= news_top_articles['date_collected'].map(lambda x: str(x)[:10])

        #dropping incomplete or duplicate information that may come into the table
        news_top_articles.dropna(inplace=True)
        news_top_articles.drop_duplicates(inplace=True)
        news_top_articles.reset_index(drop = True, inplace=True)


        #unit tests
        assert news_top_articles.content.notnull().all()

    return news_top_articles
This is my user defined function to parse the News API into the 3 things I need: title, content, and time stamp. After a bit more cleaning, each news org’s table looks similar and they’re ready to be loaded into our SQL database.
Since Google’s API doesn’t have many local news organizations, we will use BeautifulSoup to sift through all the tags, links, and content on those sites. This process can be extremely time consuming and tedious since each organization builds their site differently, (hence the reason for the API in the first place). So I will be showing one exampleof cleaning The LAist’s (Los Angeles local news org) site for this project.
General note: this is another point where we are introducing error or what some call risk into the hypothesis that I made earlier. Deriving insight from a sample size of 1 is not recommended at all.
#empty list for the links
links = []
#use 'rows' since we only want to choose the links from these articles
for row in rows:
    str_cell = str(row)
    cleantext = BeautifulSoup(str_cell, "lxml")
    #find the link part of each block (we used get_text for the titles)
    for link in cleantext.find_all('a'):
        links.append(link.get('href'))

links = links[:30]
This code will scrape all the links from the front page of LAist and then save the top 30, which will be our batch size every time. Next, we will create a similar function to the API in order to extract the same data using BeautifulSoup. Another note here is that there is no tag for when the article was published, so I will just add the date queried. If there are repeated articles listed on repeated queries, we could specify to keep the earliest day.
from functools import reduce
import datetime as dt

def create_article_from_soup(url):
    #need to make the connection between URL and soup object
    html = urlopen(url)
    soup = BeautifulSoup(html, 'lxml')
    content = soup.find_all('p')

    #loop through the content and pull out the text
    cleanish_text = [item.get_text() for item in content]
    #Need to drop the first item in cleanish text and then join all the rest together.
    cleanish_text = cleanish_text[1:]
    #Use reduce to join the whole list together into one element
    clean_text = reduce(lambda a,b : a+b, cleanish_text)

    #Code to get the title of the article for the loop later
    title = soup.find('title').get_text()
    #return title

    #There is no date listed in the article, so we'll have to use a 'date queried' datetime stamp instead
    ts_today = dt.datetime.today()
    today_string = dt.datetime.strftime(ts_today, '%m-%d-%Y') #str from time

    #Put all the elements in a list
    element = [title, clean_text, today_string]

    return element


laist_top_articles = pd.DataFrame(columns = ['title', 'content', 'date'])

for i in np.arange(len(links)):
    element = create_article_from_soup(links[i])

    article = pd.DataFrame(element).T
    article.columns = laist_top_articles.columns
    #Construct the DataFrame
    laist_top_articles = pd.concat([laist_top_articles, article])
    #dropping incomplete or duplicate information that may come into the table
    laist_top_articles.dropna(inplace=True)
    laist_top_articles.drop_duplicates(inplace=True)
    laist_top_articles.reset_index(drop = True, inplace=True)

    #unit tests
    assert laist_top_articles.content.notnull().all()
Once we have the data in the format we want, we can then load it into our CloudSQL database.
Step 1.5 Sentiment Analysis and Entity Extraction
After a bit of deliberation as to when I should add in the sentiment analysis and entity extraction bits, I decided on the extraction phase. It will not add that much data, so the upload would not be hindered in any way, plus I can test out some of the analytics that I want to show.
We can easily add a sentiment column to each table with this function
from nltk.sentiment.vader import SentimentIntensityAnalyzer

sia = SentimentIntensityAnalyzer()

def sentiment_column(news_table):
    news_table['sentiment'] = [sia.polarity_scores(x) for x in news_table['content']]
    return news_table
Each element in the sentiment column will be a dict of the sentiment values (negative/neutral/positive/compound) that we can easily extract out using another function.
#we need to get the sentiment analysis for each org into a forms that we can graph
def sentiment_tables(column):
    """Given a pandas Series of sentiment values, return a DataFrame of sentiment values and overall sentiment"""
    sent_table = pd.DataFrame(list(column))
    overall_sent = sent_table.mean()

    return sent_table, overall_sent
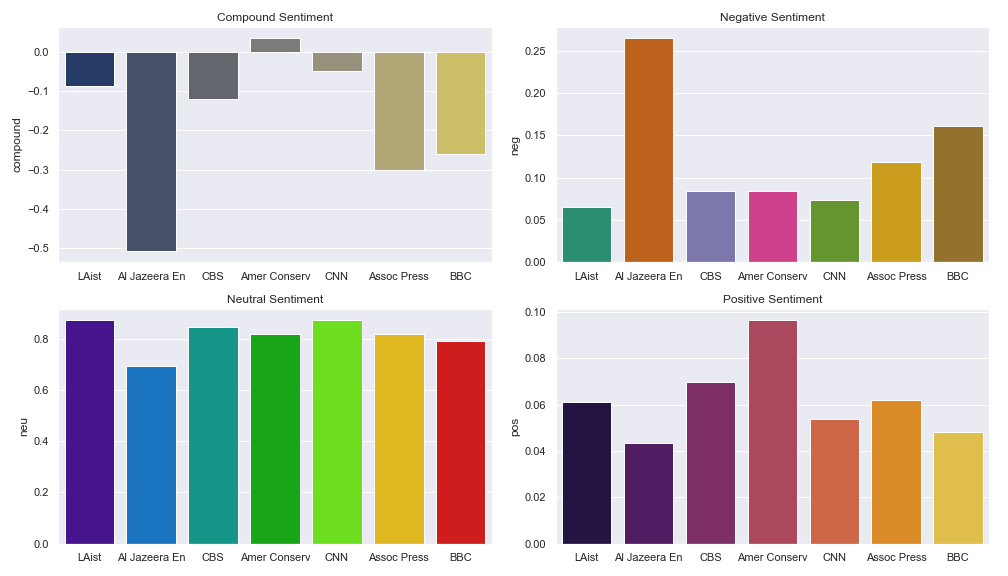
After a bit more hacking, we can easily see the overall average sentiment for each news organization on a given day. This particular data is from 5/6/19.
| compound | neg | neu | pos | |
|---|---|---|---|---|
| LAist | -0.085475 | 0.0652 | 0.873850 | 0.061050 |
| Al Jazeera En | -0.509533 | 0.2650 | 0.691667 | 0.043333 |
| CBS | -0.118710 | 0.0839 | 0.846300 | 0.069800 |
| Amer Conserv | 0.037500 | 0.0842 | 0.819200 | 0.096700 |
| CNN | -0.048070 | 0.0731 | 0.873200 | 0.053900 |
| Assoc Press | -0.300620 | 0.1185 | 0.819400 | 0.062000 |
| BBC | -0.259020 | 0.1609 | 0.791100 | 0.048000 |
The entity extraction is a little more tricky to pull off since each entity is a Spacy token object, but we can use an apply method in order to get what we need.
# Function to extract entities from an article
def extract_entities(content):
    nlp_content = nlp(content)
    items = [x.text for x in nlp_content.ents]
    return items

#Function to create a new column of entities
def entity_column(news_table):
    news_table['entities'] = news_table['content'].apply(extract_entities)
    return news_table
Once we add the entity column to each news org dataframe that we’ll save later, we create separate tables to drill down into each news org’s entities using the following nifty functions.
def extract_ent_dict(content):
  '''Function to extract entities and labels from an article and store them in a dict'''
    nlp_content = nlp(content)
    text_label_dict = {x.text : x.label_ for x in nlp_content.ents}
    return text_label_dict

def entity_table(news_table):
  '''Function to create a Dataframe for daily entities that a news org is talking about'''
    # Create an empty dataframe with the column titles for the info we want
    org_ent_table = pd.DataFrame(columns = ['entities', 'labels'])

    # extract the entities for each article (this returns a list of dictionaries)
    news_entity_article = [extract_ent_dict(x) for x in news_table['content']]

    # Looping through the dict, make a dataframe of ents and labels for each article and append to larger DF
    for i in range(len(news_table['content'])):

        article_ent_table = pd.DataFrame.from_dict(news_entity_article[i], orient='index')
        article_ent_table = article_ent_table.reset_index()
        article_ent_table.columns = ['entities', 'labels']

        org_ent_table = pd.concat([org_ent_table, article_ent_table])

    org_ent_table.reset_index(inplace=True, drop=True)
    return org_ent_table
The table below is an example of the output of the entity_table function for the BBC on 5/16/19
| entities | labels | |
|---|---|---|
| 0 | Louvre | GPE |
| 1 | Paris | GPE |
| 2 | aged 102 | DATE |
| 3 | Alabama | GPE |
| 4 | Missouri | GPE |
| 5 | eight weeks | DATE |
| 6 | US | GPE |
| 7 | Kit Harington | PERSON |
| 8 | Jon Snow | PERSON |
| 9 | HBO | ORG |
| 10 | season eight | DATE |
| 11 | Image copyrightAFP/Getty ImagesImage | PERSON |
| 12 | Taliban | ORG |
| 13 | Afghanistan | GPE |
| 14 | 2001 | DATE |
| 15 | Trump | PERSON |
| 16 | first | ORDINAL |
| 17 | a month | DATE |
| 18 | Theresa | PERSON |
| 19 | May | DATE |
| 20 | Parliament | ORG |
| 21 | Brexit | GPE |
| 22 | the first week of June | DATE |
| 23 | Mikella | PERSON |
| 24 | Alsou | PERSON |
| 25 | Azerbaijan | GPE |
| 26 | Russian | NORP |
| 27 | The Voice Kids - has | WORK_OF_ART |
| 28 | thousands | CARDINAL |
| 29 | copyrightAFPImage | CARDINAL |
| 30 | Huawei | GPE |
| 31 | China | GPE |
| 32 | US | GPE |
| 33 | Chinese | NORP |
| 34 | New Yorkers | NORP |
| 35 | Bill de Blasio's | PERSON |
| 36 | New York | GPE |
| 37 | Bill de Blasio | PERSON |
| 38 | Democrat | NORP |
From here, we can select the specific kinds of entities (People, Organizations) and compare what types of things that different news organizations are talking about. Graphs on this are a little uninformative unless you want to look at a specific event on a certain day. Soon, I will have some very informative graphs involving time series of what different news organizations are talking about since my data collection started.
Once we’re done playing around here we can load the data into a SQL database for storage.
Step 2: Set up the CloudSQL Database
GENERAL NOTE: The Google Cloud documentation is fairly difficult to navigate, have patience and keep in mind what task it is that you need to accomplish and you will succeed.
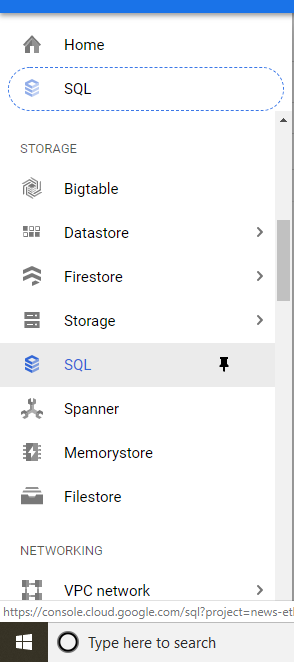
Once you create a GCP account, navigate to the “SQL” section using the side bar.
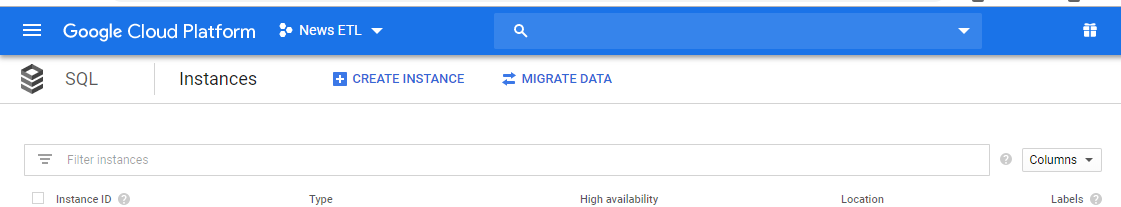
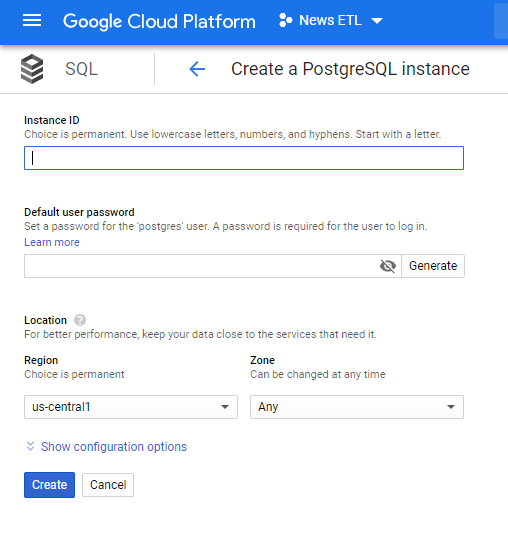
Click the “Create Instance” button near the top of the page, I used a PostgreSQL database for this project.
Make sure to save the information you input (including the password) in a text file somewhere.
After setting up the database(and saving all the information relating to it in a text file for reference later), we have a couple options we can use to create the tables we will be filling.
The first option: In your database “overview” tab, scroll down and click “Connect using Cloud Shell”. Once resources are provisioned, type:
gcloud sql connect [YOUR INSTANCE NAME] --user=[YOUR DATABASE NAME] --quiet
after typing in your database password as well, you will be able to write whatever queries you want from your database, including CREATE statements. Mine looks like this:
CREATE TABLE al_jazeera_eng_db (
	id serial,
	title CHAR(255),
	content TEXT,
	date_collected DATE);

CREATE TABLE bbc_db (
	id serial,
	title CHAR(255),
	content TEXT,
	date_collected DATE);

CREATE TABLE american_conservative_db (
	id serial,
	title CHAR(255),
	content TEXT,
	date_collected DATE);

CREATE TABLE associated_press_db (
	id serial,
	title CHAR(255),
	content TEXT,
	date_collected DATE);

CREATE TABLE cnn_db (
	id serial,
	title CHAR(255),
	content TEXT,
	date_collected DATE);

CREATE TABLE cbs_db (
	id serial,
	title CHAR(255),
	content TEXT,
	date_collected DATE);

CREATE TABLE laist_db (
	id serial,
	title CHAR(255),
	content TEXT,
	date_collected DATE);
The second way to create your tables is to save the above in a .sql file and upload to a bucket. Then, navigate to the SQL tab, click on your instance, and then click “import” near the top of the page. Browse to your bucket and select the .sql file with the create statements in there and confirm the import.
Step 3: Loading your data into the database
At this point, there are many ways to proceed, and Google Cloud documentation makes it extremely difficult to understand what the best way forward is (or even the possible ways forward). My advice is to just find a way that works for you and your business. The process I used looks like this:
- Save files to CSV on current hard drive
- Use Google Cloud SDK to copy files from current hard drive to Bucket
- Use Google Cloud SDK to copy files from bucket to their respective table in CloudSQL
(More screenshots of this coming soon)
Conclusion and Next Steps
This project is well and good for showing experience with setting up and writing to cloud databases, but what did we actually DO, and why did it save us time?
Well first, we extracted the daily top articles from 7 news organizations. If my task were to gather these resources manually, you could imagine how long that part would take. Then, we copied them over to our personal database. Doing this manually on GCP using the upload/import buttons would take about 10 minutes of supervised clicking, but using Cloud SDK we can just copy our 8 lines of code over and have it done. Nifty! All-in-all, if this were a daily task, it would save us about 15-30 minutes of doing this process manually.
The next step from here is to write a python program that will load the information from this database, extract entities and sentiment using NLP package(s), and show a report that compares news orgs based on these criteria. I may even add the entity and sentiment features into the extraction code, I’ll have to play around with it. Then the final step would be automating this whole process using a scheduled Compute Engine.
Things to do as of 4/30/19:
- Write tests for extraction function (make sure we’re not writing in duplicates or nulls)
- Write transformation and analytics program
As always, please don’t hesitate to reach out to me via email with any questions, concerns, or problems with my work! I am very open to constructive criticism and really excited to learn things that would make my projects more efficiently.

Hello! Welcome to my site. This is where I showcase my completed projects.